
“Search,
follow, and focus everywhere that there is very high daily frequency, high Beta
and high market cap then take your analysis to organize your own portfolio”
ABSTRACT
Introduction
One of the simplest statistical calculations you can carry out in Excel is correlation. Even though it is simple, it is a huge aid in understanding the relationships between two or more variables. It's crucial to understand that correlation simply reveals how closely two variables are related to one another. However, a correlation does not always predicate causation. It implies that the statement that altering one variable will alter another is not always valid. Therefore, we have to use different techniques to detect a causal relationship such as the nonlinear regression, Structural Equation Modeling (SEM), factor analysis, multiple regression analysis, path analysis, and so on. Python, R, or SCALA are the most common programming languages to learn for predictive modeling that is based on machine learning.
In this project, a predictive model using
Microsoft Excel has been designed to extract the influential relationships
among the assets.
Predictive Model
A predictive model is a type of data analysis that projects activity, behavior, and trends using both recent and historical data. Of course, when it comes to the fundamentals of prediction, we resort to traditional and fuzzy logic and state, "If p, then q." Everything begins with the relationship between these two hypotheses, "p" and "q," and is then continued and evolved by the world's cause-and-effect chain. Since there is no such thing as absolute zero in the cosmos, this network of networks will never come to an end. When I first heard about classical logic in high school, I remember wondering why the English letters "p" and "q" were used. A few years later, after learning about fuzzy logic, I speculated that these two letters might act as an "eyeglass" to help us see and understand our surroundings more clearly.

In this project, a predictive model
has been designed using Microsoft Excel.
How is the data processed by this
model?
There are four fields for data entry
in Step 1: "Date" and "Price" for each asset. Excel
requires four columns since we wish to compare two assets.
Step 2: Because there are typically
certain gaps between the dates of two assets, the system automatically matches
the dates of both assets into one column when we enter historical data for any
asset (date and price). This acts as a kind of timing index.
Step 3: In front of the index date
column, the price of each asset will be split into one column.
Step 4: The rate of return will be
calculated for each asset’s price
Step 5: According to the return
rate, the direction of motion for both assets and two consecutive days is
evaluated; if the assets are moving in the same way, the result will be
"1," otherwise "0." The total rows of return rate will then
be divided by the total number of "1"s. The outcome will be regarded
as the direction's likelihood.
Step 6: When calculating the return
rate for both assets in a single day, the distance between the points will be
taken into account. If the difference between the two points is less than the
distance change, the result will be "1," otherwise "0." The
total rows of return rate will then be divided by the total number of
"1"s. The outcome will be regarded as the distance's probability.
Step 7: The growth curve between two
assets will be measured, where if the difference return rate between two assets
in one day and the difference return rate between two assets in the next day is
less than the growth rate, it will be "1" otherwise "0".
Then total numbers of ‘1" will be divided by total rows of return rate.
The result will be considered as the probability for the growth curve.
Remark: It
appears that steps 6 and 7 are equivalent. Even though there is a significant
difference in the return rates of two assets, it is still feasible that their
growth curves are similar. As a result, I must separate the growth curve and
the distance appropriately. (Please view the video below.)
Step 8: The measurement of
the correlation using Microsoft Excel for the time series of return rates for
both assets
Step 9: Using the sensitivity
analysis in Microsoft Excel to reach the distance and growth rate with more
than 95% probability
Step 10: The aforementioned
processes (5), (6), (7), and (8) are once more computed to forecast a one-day
delay between two assets, where we say: "If asset X is high, then asset Y
will be high in the next day" and vice versa. Each of the three variables'
probabilities will be taken into account.
The figure below illustrates each of
the aforementioned steps:

Finding
Comparing the currencies
"EUR/HKD" and "EUR/AED" is one of the better examples that
have been discovered.
We can observe that this model and
the prior 10-year historical data have a strong relationship; therefore, we may
use them as the index for future investigations.
Please see below video:
Let me verify the information above
using the following historical diagram that I have taken from the Yahoo Finance
website:

Historical data of EUR/HKD (more than 10 years)

Historical data of EUR/AED (more than 10 years)
As you can see, all
three variables have a good relationship with each other, so we can say that
for a relationship rate greater than 80%, there are the following connections:
If
"EUR/HKD" is high or low, then "EUR/AED" is high or low.
And
If
"EUR/AED" is high or low, "EUR/HKD" is high or low.
Or:

Of
course, if a one-day delay is predicted, the proportion will drop
significantly.
DEMATEL Method
This
project's goal is to use the DEMATEL technique, where a portfolio of assets has
only been evaluated using one criterion, the return rate. This method aids in
depicting the ad hoc relationship between the alternative assets as well as
prioritizing them.
The
Battelle Memorial Institute's Geneva Research Center launched the Decision
Making Trial and Evaluation Laboratory (DEMATEL). DEMATEL plots a causal link
map and offers visual answers to issues, making it possible to separate many
criteria into a cause-and-effect diagram.
The
procedure of the DEMATEL technique is composed of five steps, as follows:
Step 1:
Obtain the pair-wise comparison matrix and establish a measurement scale, such
as a Likert scale.
Step 2:
Extract the direct relationship matrix of influential factors.
Step 3:
Calculate the normalized direction-relation matrix.

Where:
N = Normalized
Direction-Relation Matrix
D = Direct
Relation Matrix
dij
= a member of Direct Relation Matrix
Step 4:
Compute the Total Relation Matrix from below function:
Where:
I = the identity matrix
N = Normalized
Direction-Relation Matrix
T = Total
Relation Matrix
Step 5:
Obtain the causal relationship.
The ith
row and jth column of the complete relationship matrix T should be
designated as Ri and Cj. The sum (Ri + Cj)
indicates the degree of significance that element i (i = j) has within the
entire system. But (Ri - Cj) shows the net impact of
element i with (i = j). The net cause is revealed when the difference is
positive, and the net effect is shown when the difference is negative. The
values of (Ri + Cj) are plotted along the x axis, while
(Ri - Cj) are plotted along the y axis.
Application of DEMATEL to evaluate the relationships among the
assets
The
DEMATEL method's general steps have been used as follows:
Prior
to beginning step 1, we must choose our portfolio of assets, which should
include the company's stocks, currency pairings, cryptocurrencies, and
commodities. Since there are only a few widely used currencies and commodities,
picking them up doesn't need to take too much time, but choosing stocks does
require a plan for research and analysis.
Typically,
we order the stocks based on the six factors listed below:
- High
market capitalization (high market cap)
- High beta
(beta > 1.1)
- Very high daily frequency on the daily prices
- Very large
range of changes (return rate) per day during a period of historical data
- To track
the change in volume per day during a period of historical data
- Price-to-Earnings
Ratio (PE ratio)
The top
four factors are more crucial than the rest.
I have
chosen 20 assets for this project to create an initial matrix, and they are as
follows:
A ={X1,
X2, X3 …X20}
The
following are two different initial matrix types that have been created:
- DEMATEL approach on asset return rates with no delay
- One-day delay in the return rates of two assets using the DEMATEL
approach
Both
types of assets are examined for their direction of motion during two
successive days, and the likelihood that a relationship will exist between the
two is computed in order to create the initial matrix. It is obvious that
future studies will delve into detail and depth using the variables of distance
between the points and growth curve.
For
both categories, a Likert scale has been taken into consideration as follows:

DEMATEL approach on asset return rates with no delay
Because
the probability results represent a biconditional logical connective among the
asset return rates in this procedure, the pair-wise comparison matrix is
symmetric. As a result, step (1) is as follows:

Step 2:
By establishing the measurement scale, we will have the below Direct Relation
Matrix:

Step 3:
Normalized Direction-Relation Matrix

Step 4:
Total Relation Matrix

Step 5:
Obtain the causal relation

As you
can see, the most important asset in this portfolio has been denoted by “X5”.
One-day delay in the return rates of two assets using the DEMATEL
approach
In this instance, the return rate between two assets with a one-day delay is analyzed in both directions. As a result, we can predict the return rate of an item by a probability percentage using the return rate of another asset recorded the day prior.
Step 1: To develop the initial matrix

For
example, we can say that if the return rate of X1 is low or high,
then the return rate of X13 will be low or high in the next day by a
likelihood of 63.2%, and if the return rate of X13 is low or high,
then the return rate of X1 will be low or high in the next day by a
likelihood of 45.7%".

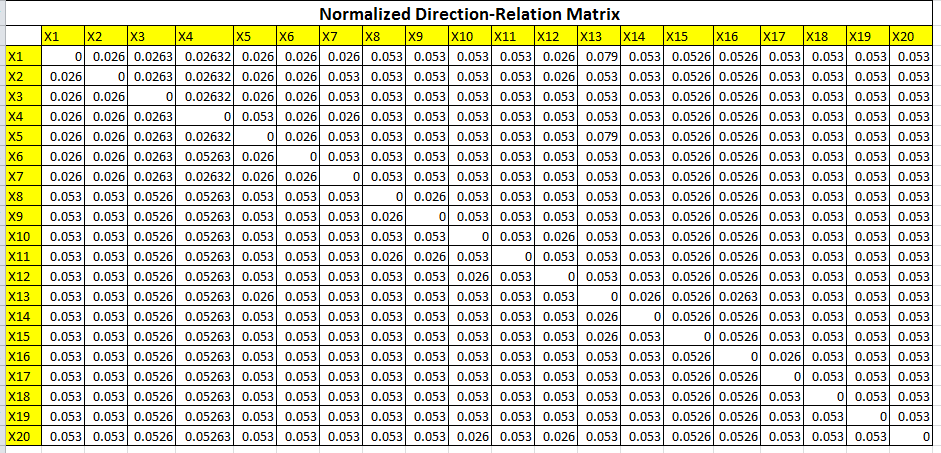
Step 3: Normalized
Direction-Relation Matrix
Step 4: Total Relation Matrix

Step 5: Obtain the causal relation

Finally, the causal relationship can
be plotted as follows:

Conclusion
What, in fact, is X12 or
X7? Undoubtedly, it relies on the way I select my portfolio. In
order to arrive at a logical conclusion, we actually need to further
investigate, analysis, and compare a large number of different portfolios.
The strategy for future research can be summed
up as follows:
- Going to details by defining a
threshold limited to select a new portfolio and examine the distance point to
point and growth curve
- Select numerous additional
portfolios and contrast them to verify the earlier findings.
- Pick the time period for the
historical data. To determine whether or not the outcomes are the same, we must
choose different time windows (what are the start time and finish time?).
- To forecast a delay of two days,
one week, or even one month as opposed to one.
Finally, a plan for future study
should be developed to evaluate particular cause-and-effect assets like X12
and X7. This plan should include reviewing annual reports, 10-K
and 10-Q reports, income statements, balance sheets, and other documents as
well as using tools such as DCF and MC methods for further analysis.