Powered By Blogger

Wednesday, October 28, 2015

A Model for Accounting Control Systems Made by Using a New Idea


 Case:  Finding balance and discrepancy between debit and credit


Assume we have 10 numbers on column of debit and 10 numbers on column of credit.

Question (1) : Which numbers are on columns debit and credit in which the total sum of one or two or three or more them on column of debit equal to total sum of one or two or three or more from numbers on column of credit?


Question (2): The most important concern is to find out the discrepancies. Where are the sources of inequalities? Which areas show us the discrepancies?

Suppose we have two columns credit and debit and 10 numbers on each column as follows:


How many series are there for each column? Definitely, there are 1024 series for each column because total subsets of a power set with 10 members is equal 2^10 = 1024
Which series from column credit are equal to some series in column debit? For example, we have below series for credit column:

x1+ x2+x10+x5
x3+x7+x1
x4 + x3 + x 6 + x 7 + x8 + x9

And below series for debit column:

y2 + y4 + y6 + y8 + y10
y1 + y3 + y5 + y7
y2 + y5 + y9

Is below equation true?


x3+x7+x1 = y2 + y4 + y6 + y8 + y10

Question 2:

If we have discrepancy between total credit and total debit, where is the location of this discrepancy?
For example: If we have:

total credit - total debit = C   

?Which one of above series does show us the location of discrepancy
Is below equation true?

(x4 + x3 + x 6 + x 7 + x8 + x9) – (y1 + y3 + y5 + y7) = C

This model answers to all above questions.
Below figures show you the components of this model:


The components of Inputs are as follows:
1. In left side on cells B3:B12, we fill amount of the credits.
2. In right side on cells C3:C12, we fill amount of the debits.
3. On cells B13 and C13, we have total sum of credits and debits.

4. On cells B14 and B15, we have the difference between credits and debits.


The components of final results for credit as Outputs are as follows:
1. On column A, we have number of answers.
2. On each row between columns B to K which is referred to one of the number of answers and also final results for debit, we have final results of credits as an answer.
3. On column L, we have total sum of each row between columns B to K.


The components of final results for debit as Outputs are as follows:
1. On column M, we have discrepancies which are the differences between total sums each row of columns B to K (column L) and total sums each row of columns O to X (column N).
2. On column N, we have total sum of each row between columns O to X.
3. On each row between columns O to X which is referred to one of the number of answers and also final results for credit, we have final results of debits as an answer.
Below figure shows you the overall picture of this model.


In fact, each row is an answer for above questions in which left side rows are related to credits and right side rows are related to debits. The total sum of each row for credits minus the total sum of each row for debits gives us the discrepancy.
You can also see below clips which are the examples for this model:


Now, let me start an complete sample to control accounting systems as follows:


Introduction


One of the most crucial reasons behind financial crisis in the world during the last decades, could be referred to business scandals and not to adhere business ethics in which it resulted in massive investment losses and numerous employee layoffs. According to KPMG’s report, financial reporting fraud (the international misstatement of financial reports) was the most costly to companies. Despite some efforts such as legislation referred to as the Sarbanes-Oxley Act of 2002 (SOX), we saw another financial crisis in 2008. These results show us the lack of an effective accounting control system in some companies around the world. Of course, big companies like Motorola, IBM, and Nike use complex systems to control and evaluate the actions of managers whereas some small companies still suffer not to have an authentic accounting control system. In this case, there are two types of people who have been involved in accounting jobs. Type one, they are someone who participate in business scandal to earn fraud money while type two are the people who want to be honest and truthful to fulfill their job but they are not able to audit the accounts for solving the problem of account balance by using of available software and finally they are disappointed and urged to present financial reporting fraud.

The purpose of this article is, trying to help the people type two such as CEOs, CFOs, Accountants, Auditors, Treasurers, and Controllers who cannot find out real proof of discrepancy among accounts and they have to fake some bills and invoices to reach the balance of accounts and finally prepare false financial report. For this approach, a case has been analyzed and solved by using a new idea derived from article of “EMFPS: How Can We Get the Power Set of a Set by Using of Excel?” posted on link: http://emfps.blogspot.com/2012/08/emfps-how-can-we-get-power-set-of-set.html
An complete sample to control accounting systems
Suppose we have below accounts on credit and debit columns:


Where can we find the discrepancies?


Important Note: “The balance of accounts in accounting is something like (0, 1) in electrical and control engineering where (0) is true and (1) is false. It means, if the balance of accounts is (0) then it is ok. But if there is even $1 discrepancy between accounts, we should doubt because it is possible there is a big case behind of the accounts. Therefore, please do not say: It is negligible.”

Before going to solve above case, we should make time bench marking for all accounts including inventories and so on.

Time Bench marking

What is time bench marking?
Time bench marking is to determine section and overall time that we are willing to audit and examine the accounts and turn all accounts accompanied by their dates including debit, credit and so on adjusted on this range of time (overall time).
Why do we need it?
It helps us to find out the easiest way to control accounts but we usually reach to two big problems in this way (making time bench marking) as follows:
1.      We often find several payments or earnings in the same exact date, therefore we cannot turn these accounts on overall time to make time bench marking. Let me tell you an example as follows:

We have below accounts accompanied by their dates and we want to control them in the range of time between Oct 1, 2015 and Oct 31, 2015.


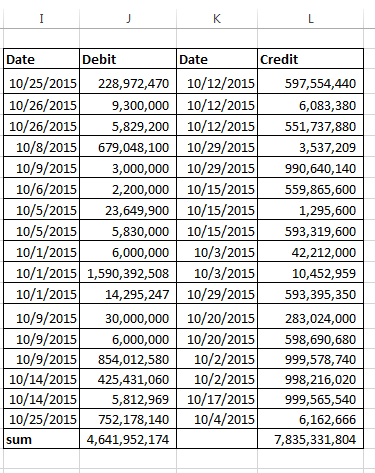
We have to sum simultaneous payments and earnings to include between above duration.
How can we do it?
At the first, we use DATA – Remove Duplicates in excel for dates of debit then we copy columns of date and debit on columns A and B in excel and also copy the results of dated inferred by DATA – Remove Duplicates on column C. Next, we copy formula:

=sumif($a$1:b50,c1,$b$1:$b$50) on column D and copy to down as follows:


Using the same way for dates of credit:


1.      Sometimes we have to pay to some contractors advance payment or we cannot receive the bill in the time of payment consequently our accounts will not be closed and we will have the mixed dates for our accounts (please see above excel sheets on column D)
How can we solve this problem to adjust on time benchmarking?
- On column A in excel sheet copy all dates between Oct 1, 2015 and Oct 31, 2015
- Above data of dates and debit copy on columns E and F
- Copy on cell B1formula:
 =IFERROR(INDEX($E:$F,MATCH($A1,$E:$E,0),COLUMN(A1)),"")
- Copy above formula to C1, then copy down both cells
Here is the results:


- Do above steps for dates and credit as follows
:


Now, we can return back to solve the case. 

   Answer to question (1): I applied a new idea derived from article of “EMFPS: How Can We Get the Power Set of a Set by Using of Excel?” posted on link: http://emfps.blogspot.com/2012/08/emfps-how-can-we-get-power-set-of-set.html and solved the case. The results are as follows:


As we can see, there are 19 statuses (rows) where the sum of numbers in each row for debit is equal to the sum of numbers in same row for credit.
Answer to question (2): It is solved by using of new idea mentioned in question (1). The results are as follows:


According to this case, total difference between debit and credit is equal to   -3,595,545,920.
Above tables show us that there are 20 sets of numbers or 20 areas for debit and credit in which we can find the discrepancies.

All researchers and individual people, who are interested in having this model, don’t hesitate to send their request to below addresses:


Tuesday, September 15, 2015

Conditional Probability and Bayes ‘Theorem: An Application of Coding by Excel


When we are willing to apply the ideas of the statistics in the fields of engineering, sometime classic probabilities or fre­quen­tist sta­tis­tics, which deals with things like nor­mal dis­tri­b­u­tion, bell curves, and so on, does not as well as work so that we need another idea of the statistics, which is named Conditional probability or Bayes’ theorem. Bayesian probability theory is now commonly employed (oftentimes with stunning success) in many scientific disciplines, from astrophysics to neuroscience. It is most often used to judge the relative validity of hypotheses in the face of noisy, sparse, or uncertain data, or to adjust the parameters of a specific model.
The purpose of this article is to solve some types of complicate problems by using conditional probability and the methodology stated in article of “EMFPS: How Can We Get the Power Set of a Set by Using of Excel?” posted on link: http://emfps.blogspot.com/2012/08/emfps-how-can-we-get-power-set-of-set.html
An example has been analyzed and solved by this method.


Introduction
Conditional probability is referred to probability of an event or outcome based on the occurrence of a previous event or outcome.  Conditional probability is calculated by multiplying the probability of the preceding event by the updated probability of the succeeding event.
Consider the events of “A” and “B”. The probability of event B is calculated by below formula, if event A was already occurred:

 P (B|A) = P (AÇ B) /  P (A)   ,  P (A) > 0

Bayes’ rule really involves nothing more than the manipulation of conditional probabilities. Bayesian probability theory provides a mathematical framework for performing inference, or reasoning, using probability. Bayesian logic is a branch of logic applied to decision making and inferential statistics that deals with probability inference: using the knowledge of prior events to predict future events. Bayes' theorem provided, for the first time, a mathematical method that could be used to calculate, given occurrences in prior trials, the likelihood of a target occurrence in future trials. According to Bayesian logic, the only way to quantify a situation with an uncertain outcome is through determining its probability.

Bayes' Theorem is a means of quantifying uncertainty. Based on probability theory, the theorem defines a rule for refining a hypothesis by factoring in additional evidence and background information, and leads to a number representing the degree of probability that the hypothesis is true.

According to Andrew Anderson (2012), Bayesian analy­sis is the use of con­di­tional or evi­den­tial prob­a­bil­i­ties. It looks at what you know of the envi­ron­ment and past knowl­edge, and allows you to infer prob­a­bil­i­ties based off of that data.

Here is an example that shows us the difference between classic probability and Bayesian approach:

In a company, the pop­u­la­tion of females is 32%, so that means that if I select some­one at ran­dom from my office, I have a 32% chance of pick­ing a female. The chances are purely based on the total prob­a­bil­ity. The Bayesian approach is to rely on past knowl­edge and then adjust accord­ingly. If I know that 25% of my office is male, and I grab a per­son, then I know that I have a 75% chance of pick­ing a female.

So is it 32% or 75%? Both are cor­rect answers depend­ing on what ques­tion you are really ask­ing, but both look at things dif­fer­ently.

Now, let me bring a complicate case and analyze it by using of the method posted on link: http://emfps.blogspot.com/2012/08/emfps-how-can-we-get-power-set-of-set.html

Case: Assume we have a box including 7 green balls and 5 red balls. We reach in and pull out 4 balls. If there is the probability of P (A) that 3 balls from 4 are green then, what is the probability of fourth ball that will be red?

Solution:

Conceptualize: Imagine we have two events A and B in which they are defined as follows:
A = event of 3 green balls from 4 balls

B = event of one red ball from 4 balls
Categorize: We should calculate P (B|A) by using of below formula:


 P (B|A) = P (AÇ B) /  P (A)   ,  P (A) > 0
 

How can we calculate P (AÇ B) and P (A)? In this case, I used from coding system in excel. In fact, I gave to any random ball into box a number. Therefore, we have 12 balls which each one has a number of 1 to 12. Since we have 4 balls from 12, I obtained all combinations or binomial [12, 4] or C (12, 4) because we have not any repetition and also the replacement does not matter, if we assign to any random ball a number. Finally, I calculated above probabilities step by step as follows: 

Analyze: Let me start step by step this method by using of excel:

Ø  Type “c” into cell A1 in your spreadsheet

Ø  Type into cell A2 the number of choices which is 4

Ø  Type into cells of: 

A3 = 1

A4 = 2

A5 =3

A6 =4

A7 =5

A8 = 6

A9 =7

A10 =8

A11 =9

A12= 10

A13= 11

A14 = 12

Ø  Now, we can run macro from VB code written by Myrna Larson to obtain all combinations. You can find this code on link: http://emfps.blogspot.com/2012/08/emfps-how-can-we-get-power-set-of-set.html
There are two methods to solve this problem as follows:

Method of event A:

Ø  Type formula:  =IF(A1<=7,1,0) on cell F1. Because we have 7 green balls

Ø  Draw above formula for G1, H1 and I1 and also draw down all four cells for 495 columns

Ø  Type formula: =IF(SUM(F1:I1)=3,1,0) on cell J1 and formula: =IF(SUM(F1:I1)>=3,1,0) on cell K1 and also draw down all two cells for 495 columns

Ø  On cell J496 type formula: =SUM(J1:J495) and on cell K496 type formula: =SUM(K1:K495)

Ø  Now, we can calculate the probabilities as follows:

Ø  P (AÇ B) = cell J496 / 495 = 0.353535354

Ø  P (A) = cell K496 / 495 = 0.424242424

Ø  P (B|A) = 0.83333333
Method of event B:

Ø  Type formula:  =IF (A1<=5, 1, 0) on cell F1. Because we have 5 red balls

Ø  Draw above formula for G1, H1 and I1 and also draw down all four cells for 495 columns

Ø  Type formula: =IF(SUM(F1:I1)=1,1,0) on cell J1 and formula: =IF(SUM(F1:I1)<=1,1,0) on cell K1 and also draw down all two cells for 495 columns

Ø  On cell J496 type formula: =SUM(J1:J495) and on cell K496 type formula: =SUM(K1:K495)

Ø  Now, we can calculate the probabilities as follows:

Ø  P (AÇ B) = cell J496 / 495 = 0.353535354

Ø  P (A) = cell K496 / 495 = 0.424242424

Ø  P (B|A) = 0.83333333

In the next articles, I will bring you the examples of real world in the field of engineering (Turbo molecular pumps) and also in the field of strategic management (External Real Forces and Pseudo-Forces to Design a Strategic Plan).

To be continued……..


Sunday, February 23, 2014

Analysis and Design Open Oscillatory Systems with Forced Harmonic Motion (1)

Consider a child, who is playing with a swing. During the period of the time, he learns to apply the optimum force to the swing in order to minimize efforts and maximize the amplitude of the swing. How? The answer is that driving force should be applied periodically and should be timed to coincide closely with the natural motion of the swing.In other words, a driven oscillator responds most strongly when driven by a periodically varying force, the frequency of which is closely matched to the frequency with which the system would freely oscillate if left to it. This frequency is called the natural frequencyof the oscillator.
The purpose of this article is to utilize some methodologies such as sensitivity analysis and Monte Carlo simulation model to analyse and design open systems which have the damped harmonic motion and are also forced by external oscillatory forces. A case of “Is There Any Mechanical Oscillatory System Where Maximum Velocity of Resonance Will Increase More Than Speed of the Light?” has been analysed by using of the methodology stated in article of “EMFPS: How Can We Get the Power Set of a Set by Using of Excel?” posted on link: http://emfps.blogspot.com/2012/08/emfps-how-can-we-get-power-set-of-set.html.

Introduction
There are three types of oscillatory motions as follows:

1. Mechanical waves:These involve motions that are governed by Newton’s laws and can exist only within a material medium such as air, water, rock, etc. Common examples are: sound waves, seismic waves, etc.

2. Matter (or material) waves:All microscopic particles such as electrons, protons, neutrons, atoms etc. have a wave associated with them governed by Schrödinger's equation.


3. Electromagnetic waves:These waves involve propagating disturbances in the electric and magnetic field governed by Maxwell’s equations. They do not require a material medium in which to propagate but they travel through vacuum. Common examples are: radio waves of all types, visible, infra-red, and ultra-violet light, x-rays, and gamma rays. All electromagnetic waves propagate in vacuum with the same speed of the light(c = 300,000 km/s).


First of all, I am willing to start the analysis and design of a mechanical system which is harmonically moving and it has been referred to Mechanical waves (Item 1). Before that, let me tell you a summary of damped and forced SHM.

Damped Harmonic Motion:
We know that a SHM can infinitely continue its motion, if there is not any friction force. In this case, a mass connected to a spring will have oscillatory motion forever. But the amplitude of SHM usually decreases and is closed to zero due tofriction force. We say that is a Damped Harmonic Motion (DHM). The damped force depends on the velocity of the particle and it can be calculated from formula: - b(dx/dt) where “b” is a positive constant number. The equation of the motion is obtained by using of Newton’s laws(F = ma) as follows:


Reference: K. R. Symon, Mechanics. Third edition, Addison – Wesley Publishing Company, 1971, Section 2.9.

Forced Harmonic Motion (FHM):
But if an external oscillatory force is affecting on an open system with DHM, we can analyze the equation of motion in accordance with below formula:


 Reference: K. R. Symon, Mechanics. Third edition, Addison – Wesley Publishing Company, 1971, Section 10.2.

In this case, when the frequency of external force reaches to natural frequency of our system, we will have the resonance.
Regarding to above equations, we can see that the most important parameters for analysis and designing of an open system are as follows:
Fm = External force (N)
k = Restoring constant of system (N/m)
m = mass of system (kg)
b = Damped force constant of system (kg/s)
ω'' = Angular velocity of external force (rad/s)

Methodologies

I used from three methods in which each one is assigned to one type of the oscillatory motions as follows:

- For mechanical waves, I consider to utilize the method mentioned in article of “EMFPS: How Can We Get the Power Set of a Set by Using of Excel?” posted on link: http://emfps.blogspot.com/2012/08/emfps-how-can-we-get-power-set-of-set.html.As an example, I will analyze a case by using of this method where the result will be the options for designing.

- For matter (or material) waves, I will use fromMonte Carlo simulation method stated in my previous articles such as “Application of Pascal’s Triangular plus Monte Carlo Analysis to Find the Least Squares Fitting for a Limited Area” posted on link: http://emfps.blogspot.com/2012/05/application-of-pascals-triangular-plus_23.html.As an example, I will examine the oscillatory motion of a free neutron to find out its coordination in related with the time.

-For electromagnetic waves,I will utilize from Sensitivity Analysis and as an example, I will analyze a case of energy carried by Gamma ray.

1. A Case of Mechanical Waves

Case: Is There Any Mechanical Oscillatory System Where Maximum Velocity of Resonance Will Increase More Than Speed of the Light?”

Assume we are designing an open system under force harmonic motion. What are the parameters of designing? According to above mentioned, they are as follows:

Fm = External force (N)
k = Restoring constant of system (N/m)
m = mass of system (kg)
b = Damped force constant of system (kg/s)
ω'' = Angular velocity of external force (rad/s)

We are willing to know if there is any mechanical system with FHM  in which maximum velocity of this system will go up more than 3E+8 m/s. What is the range for parameters of designing?
I used from the method stated in article of “EMFPS: How Can We Get the Power Set of a Set by Using of Excel?” posted on link: http://emfps.blogspot.com/2012/08/emfps-how-can-we-get-power-set-of-set.html.
I would like to remind you that we applied VB code written by Myrna Larson where the method of designing is step by step as follows:
- I know that the velocity of our system is the function of the above parameters (independent variables): V = f (Fm, k, m, b, ω’’) and we need to have Vm> 3E+8 m/s
- I consider a random domain for all five parameters for instance: 0.1 <(Fm, k, m, b, ω’’)< 1
- I start my calculation by using of Myrna Larson’s VB code and excel spreadsheet program.I have to analyse only 30240 column forcalculations simultaneously (=Permut(10,5))becuse my PC has not necessary instruments to analyse big data.
- I change the domain for all five parameters: 0.001 <(Fm, k, m, b, ω’’)< 100
- I continue to change the domain where I reach: 0.000001 ≤ (Fm, k, m, b, ω’’) ≤ 1000
In this domain, I found 17 types of the parameters where maximum velocity of our system is equal to 1E+9 m/s > c = 3E+8 m/s. It means that we can have 17 types of design for our system to reach maximum velocity more than speed of the light. All parameters for designing have been arranged in below Table:


As we can see, the most crucial thing is that our system will reach to maximum velocity more than speed of the light, if external oscillatory force goes up more than 1KN and damped force constant decrease less than 1E-6 kg/s. In fact, the boundary conditions are:

Fm ≥ 1KN               and                  b ≤ 1E-6 kg/s

2. A Case of Matter (or material) waves

Case:How Can We Find the Coordination of Free Neutrons in the Space of Entropy? 

The neutron is electrically neutral as its name implies. Because the neutron has no charge, it was difficult to detect with early experimental apparatus and techniques. Today, neutrons are easily detected with devices such as plastic scintillators.Neutrons are elementary particles with mass mN= 1.67 × 1027 kg.
Free neutrons are unstable. They undergo beta-decay whereits half-life is approximately between 614 to 885.7 ± 0.8 s. Neutrons emitted in nuclear reactions can be slowed down by collisions with matter. They are referred to as thermal neutrons after they come into thermal equilibrium with the environment. The average kinetic energy of a thermal neutron is approximately 0.04 eV. This moderated (thermal) neutrons move about 8 times the speed of sound. Typical wavelength (λ)values for thermal neutrons(also callednon-relativistic neutronscold) are between 0.1 and 1 nm. Their properties are described in the framework of material wave mechanics. Therefore, we can easily calculate de Broglie wavelength of these neutrons. But can de Broglie wavelength help us to solve this case? How?

As I stated, the analysis of an oscillatory neutroncan be done by Schrödinger's equation. The general figure of this equation is as follows:


To solve above equation for boundary conditions, we need to apply a strong method. Can Monte Carlo Simulation method help us to analyse this case?
For using of Monte Carlo simulation model, I firstly choose the probability distribution inferred from Binomial and Bayesian method to obtain a framework referred to entropy of these neutrons…..

Note:  “All spreadsheets and calculation notes are available. The people, who are interested in having my spreadsheets of this method as a template for further practice, do not hesitate to ask me by sending an email to: soleimani_gh@hotmail.com or call me on my cellphone: +989109250225. Please be informed these spreadsheets are not free of charge.”
To be Continued……………

Monday, January 27, 2014

Is There Any Absolute Zero in the Universe?

In the reference with my previous article of "External Real Forces and Pseudo-Forces to Design a Strategic Plan" posted on link: http://emfps.blogspot.com/2013/12/external-real-forces-and-pseudo-forces.html, I ask you: “Is not really there any “ABSOLUTE ZERO” in the universe with high speed changes?”
The mathematics logic proves us that there is not any “ABSOLUTE ZERO” in the universe with high speed changes. If you perceived the concept of “ABSOLUTE ZERO” referred to the naturalphenomena such as the temperature in Kelvin scale (-273.15 oC) in which Absolute Zero corresponds to no motion at the atomic level, it also works. How?
Let us consider below propositions:
p = There is absolute zero at temperature of -273.15 oC
q = There is not any motion at the atomic level in absolute zero.
We say the composition implication:[If “p” then “q”] will be true, if “p” and “q” are true or both of them are false or only “q” is true.
Now, let me tell you an example that I found about quantum harmonic oscillator as follows:
A diatomic molecule vibrates somewhat like two masses on a spring with a potential energy that depends upon the square of the displacement from equilibrium. But the energy levels are quantized at equally spaced values.
The energy levels of the quantum harmonic oscillator are:
En = (n + 0.5) ђω,    n = 0, 1, 2, 3,…..
ω = 2π (frequency)
Ñ’ = Planck’s constant / 2Ï€
And for a diatomic molecule the natural frequency is of the form:
ω = (k/mr) ^0.5
k = bond force constant
mr = reduced mass
Where the reduced mass is given by:
mr = m1m2/(m1+m2)

This form of the frequency is the same as that for the classical simple harmonic oscillator. The most surprising difference for the quantum case is the so-called zero-point vibration of the n=0 ground state. This implies that molecules are not completely at rest, even at absolute zero temperature.
Therefore, our composition implication (If “p” Then “q”) will be the true, if “p” is the false because “q” is alsothe false. In the result, we have:
There is not any absolute zero at temperature of -273.15 oC”

Another example is:“Physicists of the Ludwig-Maximilians University Munich and the Max Planck Institute of Quantum Optics in Garching have now created an atomic gas in the lab that has nonetheless negative Kelvin values (Science, Jan 4, 2013).”
You can read the article of “Researchers force a gas to a temperature below absolute zero” byBob Yirka on Jan 04, 2013 posted on below link;


Wednesday, January 1, 2014

Balance Scorecard and Fuzzy Logic Control

Probably you have heard some people say: “I work very hard for my organization but nobody perceives my hardworking” or “While I as well as fulfill my obligations for my organization, my colleague who usually wastes all his/her time at the office, gains the most promotions” or “How can my organization assess the value of my activities at the office?”.
Let us assume, someone who starts his/her work at the office every day, will be able to track his/her ranking, points or value of activities among all staff of the organization on his/her PC after time out. It is clear, all above concerns and questions will be cleared in which the motivation of the staff to do their jobs will increase and consequently work efficiency and productivity will go up at workplace.
The Balanced Scorecard (BSC), organized by Kaplan and Norton (1992, 1993, and 1996), abandoned the traditional approach of concentrating on financial data, and focused on four general perspectives: financial, customer, internal business and innovation and learning. Balanced scorecard is a management system and strategic management planning which is started by Dr. Robert Kaplan and David Norton and they used that as a performance measurement framework. The balanced scorecard is using widely in industries, nonprofit organizations and government all around world to improve monitoring the organization’s performance and compare the organization’s goals with the actual performance and internal and external communications. This performance measurement framework was used first to give the managers a better view of organization performance specifically to compare the financial situation of the company. However this practice with the name of balanced scorecard introduced in 1990s, the background of that is older like General Electric that has performance measurement reporting in the 1950s and the work of French process engineers in 20th century. The process of improving the balanced scorecard started from simple performance measurement framework to a general strategic planning and organizational planning mechanism.
Even though many companies utilize from BSC as a strategic management system, some research and case studies show us that nowadays it does not as well as work due to high speed changes around the world. Since a BSC framework is designed by using of a cause – effect system, we can use Fuzzy Logic Control to assign the accurate points and rankings into BSC framework (referred to previous articles of “External Forces and Pseudo-Forces to Design a Strategic Plan” and “What Is the Goal of a Central Bank in Related with Deficit Financing?”).